CPU
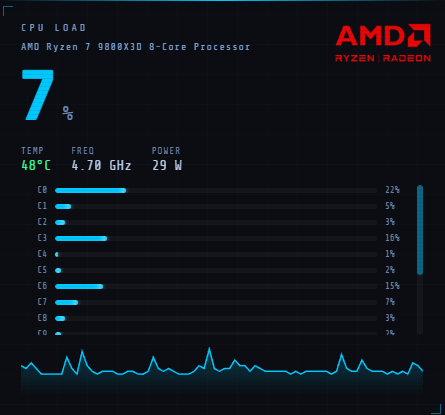
Total and per-core load with sparklines, current clock frequency, package temperature, and power draw.
- Total & per-core load (%)
- Clock frequency (GHz)
- Package temperature (°C)
- Package power (W)
Real-time hardware monitoring built for a vertical secondary display — or scatter individual panels freely across any screen in floating mode. CPU, GPU, RAM, network, disk, NVMe/SSD temperatures, motherboard sensors, live process monitor, and a built-in multi-GPU selector for stable tracking.
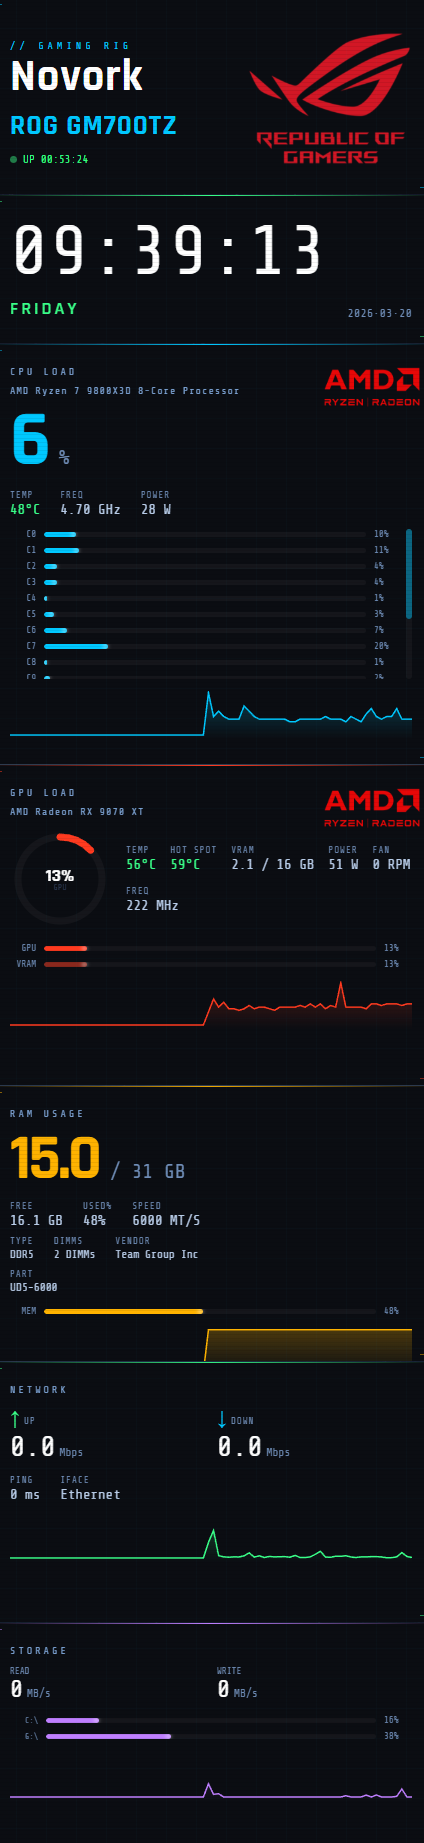
Designed for 450 × 1920 vertical side displays. Multiple display profiles fit different monitor sizes.
LibreHardwareMonitor provides per-core clocks, GPU hot-spot, memory clock, VRAM, fan RPM, and D3D engine workloads — not just OS counters.
When your system has both iGPU and dGPU, use the GPU panel selector to pin exactly which device should be shown.
CPU model, GPU name, RAM spec, and system brand logo are all detected at startup with no manual config.
All data stays on your machine. No accounts, no cloud, no background uploads. Ever.
Configurable warning and critical thresholds for CPU, GPU, RAM, and disk. Windows tray notifications fire when a component runs hot — with a cooldown to prevent spam.
Checks for new versions in the background every 6 hours. A badge in the header lets you update with one click — no manual download required.
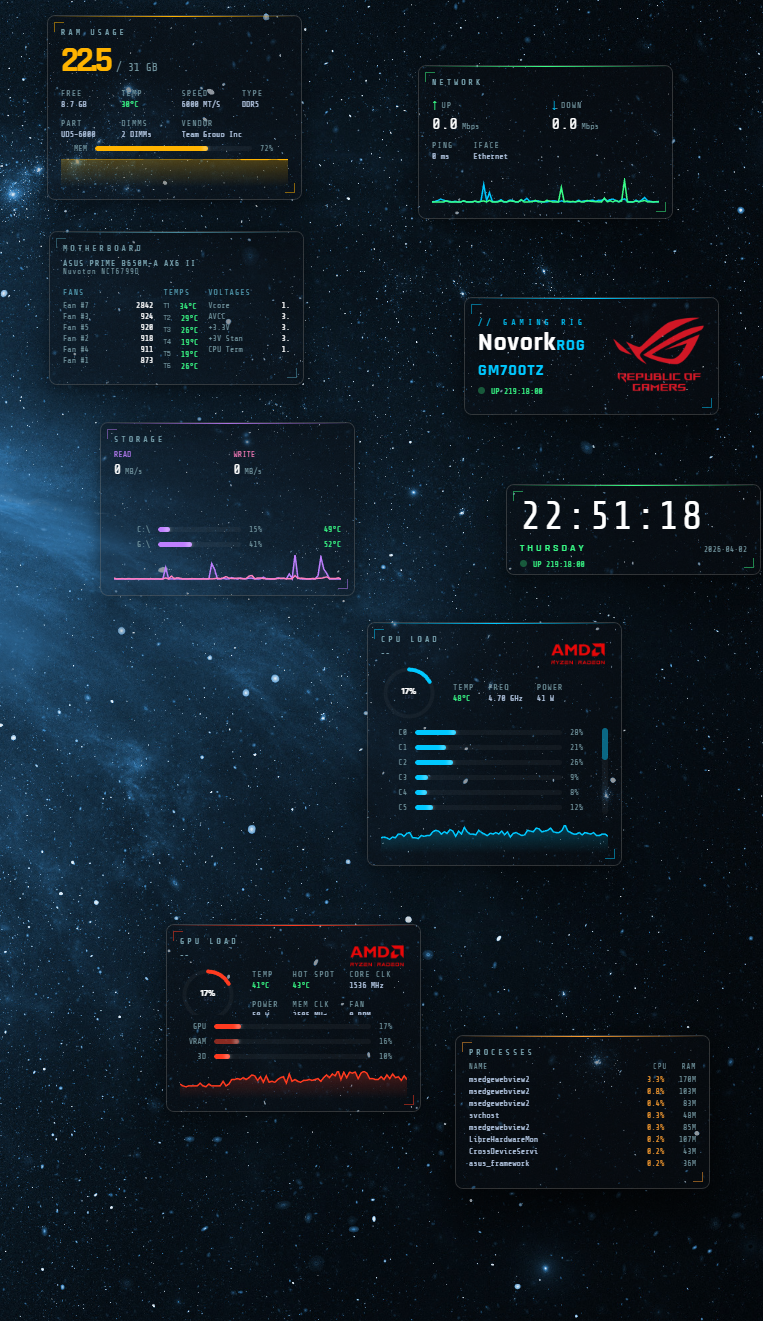
Switch to floating mode and each panel becomes a draggable, always-on-top window you can place anywhere on any screen. Positions persist across restarts.
Portrait mode fills a dedicated vertical display. Floating mode lets you place each panel wherever it fits — on your gaming monitor, your side screen, or anywhere between.
Each panel tracks exactly what matters for that component — with sparkline history so you see trends, not just a snapshot.
Total and per-core load with sparklines, current clock frequency, package temperature, and power draw.
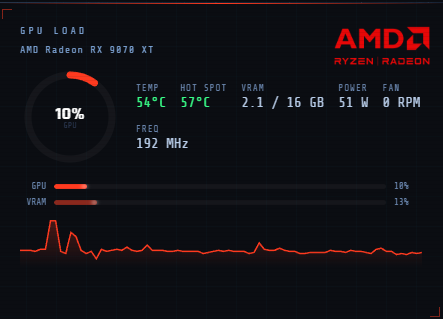
Core load, temperatures, clocks, power, VRAM, and fan load. D3D engine workload breakdown shows when the GPU is rendering 3D or decoding video. Includes a multi-GPU selector so you can pin a specific GPU instead of auto-switching each tick.
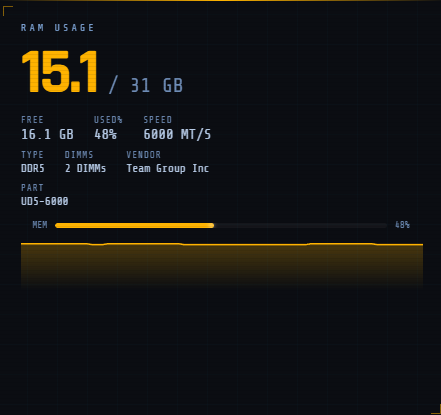
Current usage alongside the full memory spec read directly from BIOS — type, speed, stick identification, and live DDR5/DDR4 temperature.

Live upload and download throughput for the best active interface, plus LAN gateway and WAN latency. Upload and download are shown as separate coloured series in the sparkline.
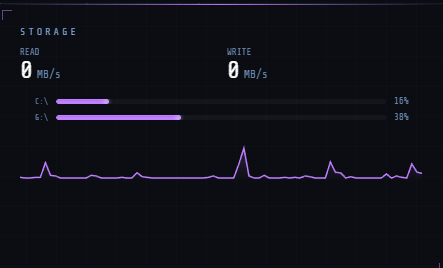
Aggregated read and write throughput across your primary drives, plus per-drive capacity, usage, and live NVMe/SSD temperature. Read and write are shown as separate coloured series in the sparkline with matching coloured labels.
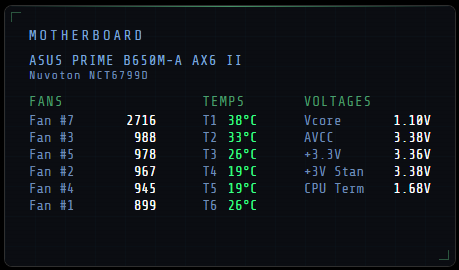
Super I/O chip sensors for the full board — all active fan channels, board temperatures, and key voltage rails. Board name and chip model auto-detected at startup. Optional panel, enabled in Settings.
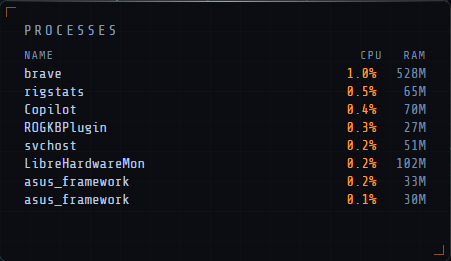
A miniature Task Manager always visible on the portrait display. Shows the top 8 processes sorted by CPU usage so you can instantly see which game, encoder, or background service is consuming your hardware. Optional panel, enabled in Settings.
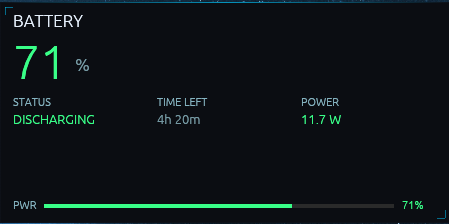
Live battery status for gaming laptops. Shows charge percentage, charging/discharging state, estimated time remaining, and live power draw. Optional panel; shows "NO BATTERY" gracefully on desktop systems.
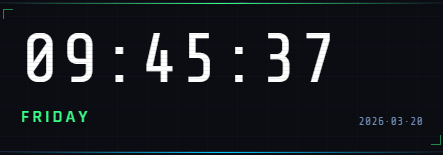
Current time, day, and date displayed cleanly at the top of the dashboard — always visible at a glance.

System brand, hostname, and model name auto-detected at startup. Recognized gaming OEMs — ROG, MSI, Alienware, Legion, OMEN, Razer, Predator, AORUS — display their brand logo automatically.
Accessible from the system tray icon. Each dialog has a single, focused purpose.
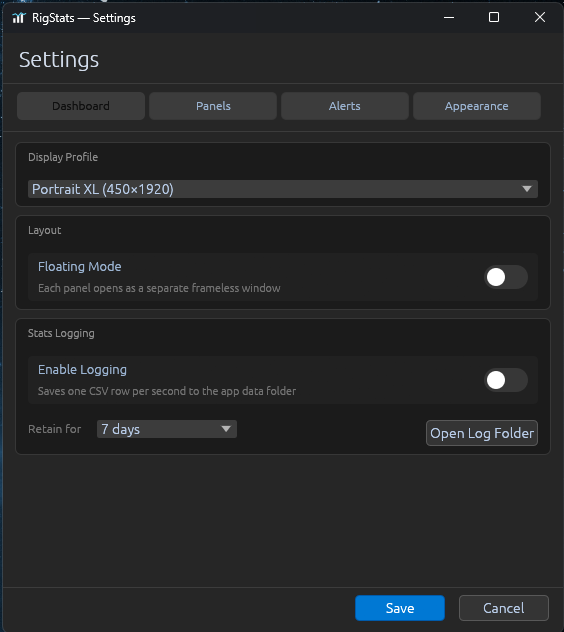
Four focused tabs to configure every aspect of the dashboard. Changes apply as a live preview; Cancel restores the previous state.
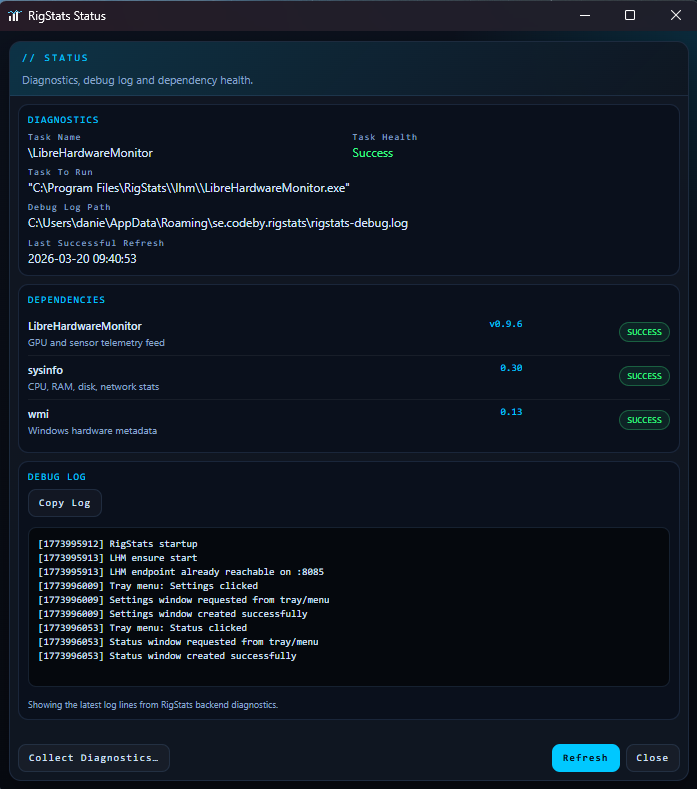
Runtime health view for every data source. Shows the rigstats-sensor Windows Service state, dependency health indicators, GPU driver versions with age warnings, the live debug log, and last successful refresh time.
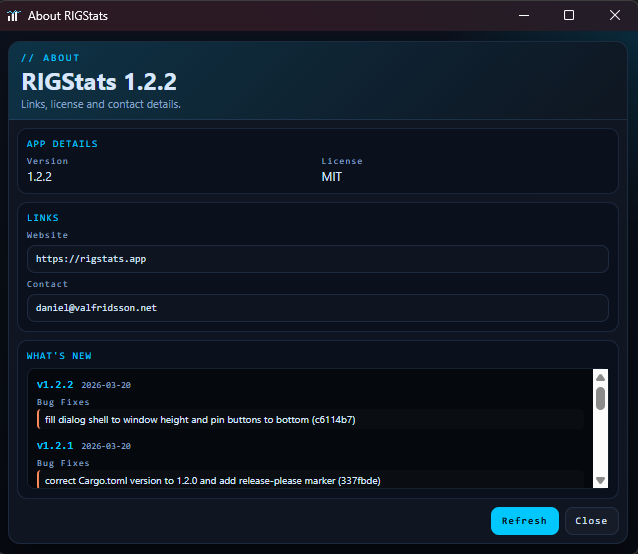
Product information at a glance. Shows the current version, license, contact links, and the full technology stack the app is built on.
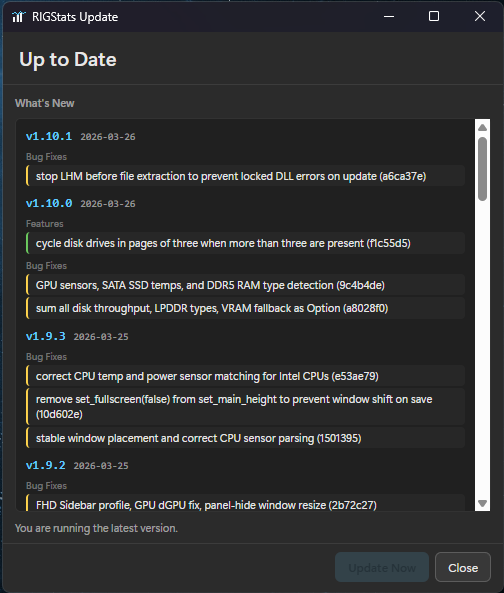
Checks for new versions silently in the background every 6 hours. When an update is ready, a badge appears in the dashboard header. The dialog shows the new version's release notes from GitHub alongside the full local version history.
A single NSIS installer handles everything — including setting up LibreHardwareMonitor as a Windows scheduled task so sensor data is available immediately at startup.
Grab the latest .exe from the releases page below.
Accept the UAC prompt — admin rights are needed to register the LibreHardwareMonitor scheduled task.
The app starts to the tray. Click the icon to open the dashboard or access Settings, Status, About, and Updates & Changelog.
All versions available on the GitHub Releases page.
RIGStats has a built-in diagnostics export that captures everything needed to investigate sensor or hardware compatibility issues.
Right-click the tray icon → Status.
A Windows save dialog lets you choose where to store the ZIP archive.
The archive contains the debug log, sensor tree, hardware info, and settings — no personal files or credentials.
| File in ZIP | Contents |
|---|---|
debug.log | Full startup and runtime log |
sidecar-parsed.json | Last sensor payload from the sidecar — GPU, CPU, fans, disk temps |
sensor-tree.txt | Full LHM hardware and sensor tree at last service start — identifiers, types, and values |
hardware.json | WMI snapshot: OS, CPU, GPU, motherboard, RAM |
settings.json | Current user settings |
sidecar-service.txt | rigstats-sensor Windows Service state |
sysinfo.json | sysinfo snapshot: CPU, disk, network, RAM |
environment.txt | Windows build, architecture, computer name |
Nothing is uploaded automatically. The ZIP is a local file — you decide whether to share it.
Create a GitHub issue and attach the diagnostics ZIP for the fastest resolution.
Architecture notes, setup guide, release process, and troubleshooting docs are maintained in the repository.
Browse docs on GitHub →